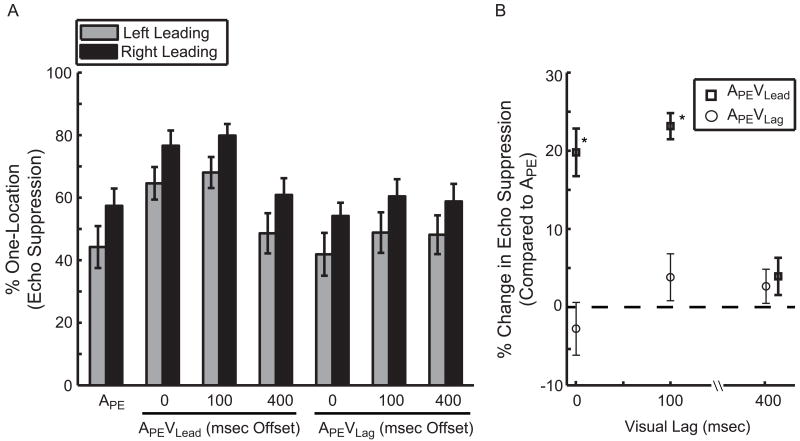
Figure 3.
Visually enhanced echo suppression critically depends on gross temporal alignment. (A) The mean percentage of one-location responses (echo suppression) is plotted as a function of condition and side. Naming conventions are identical to those in Figure 1. Integer values along the abscissa represent the delay (msec) of the visual stimulus relative to the onset of the spatially coincident auditory stimulus. (B) The difference in echo suppression between conditions APEVLead and APEVLag relative to APE at 0, 100, and 400 msec visual lag. Importantly, the visual contribution to echo suppression is eliminated with a 400 msec offset. Symbols are offset at 400 msec delay for clarity. (*p<0.001) (N=18; mean ± SEM)

