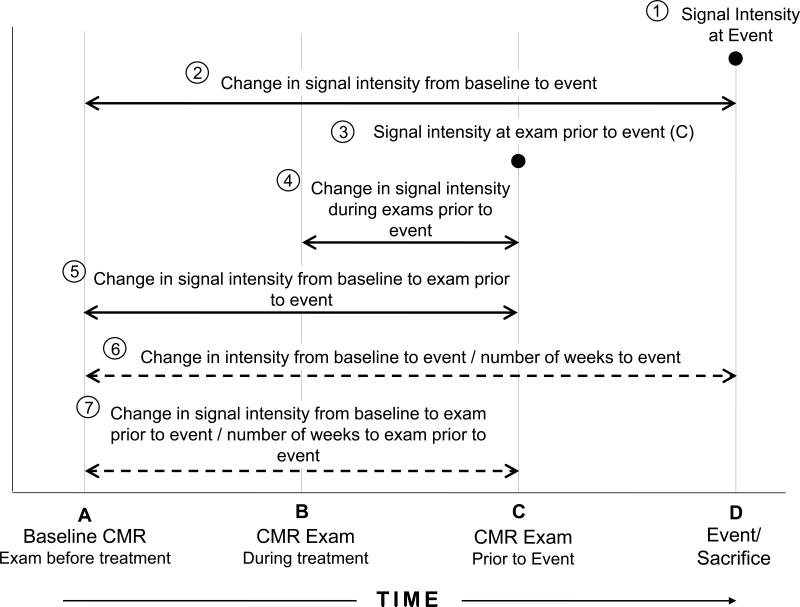
Figure 2. Gadolinium CMR sample points and intervals.
Longitudinal study design showing the multiple sample points and intervals for assessing the relationship between signal intensity and left ventricular ejection fraction measures. For animals not experiencing events, the last point in time sampled for the animal served as their final sample point (labeled D on the Figure).

