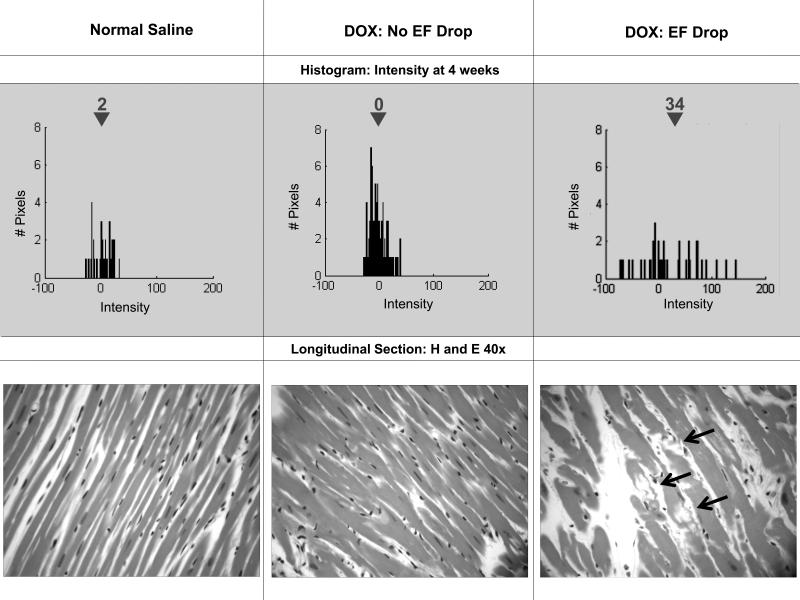
Figure 4. Serial histograms and histopathology.
On the top portion of the Figure, 4 week histograms of the number of pixels (y-axes) and intensities (x-axes) in individual animals after receipt of saline (top left), doxorubicin without (top middle) and with (top right) an ejection fraction (EF) drop. On the right are 40-power haematoxylin and eosin (H&E) histopatholigic images from the same animals. As shown, mean intensity increased in the animals that dropped their EF corresponding to vacuolization (arrows bottom right H&E).

