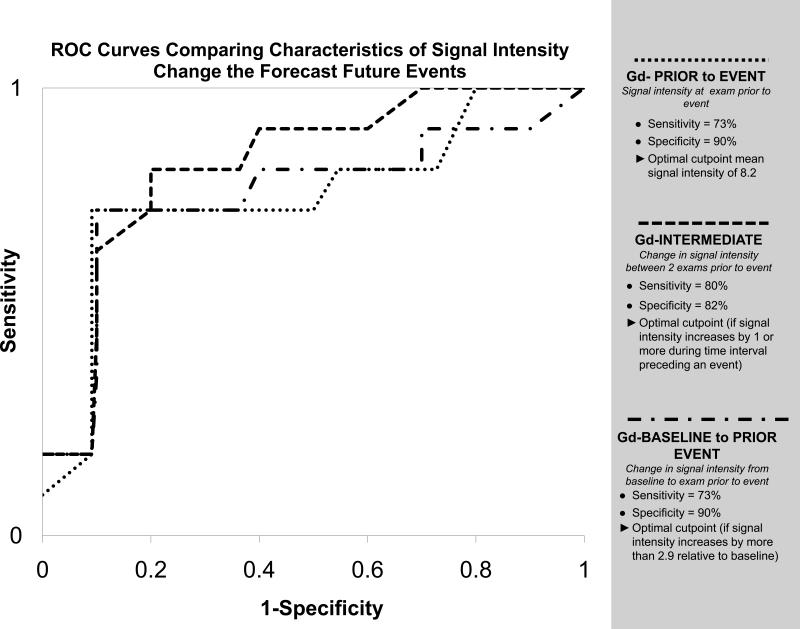
Figure 5. Prediction of future primary events.
Receiving operator characteristic curves to determine the cutoff point for: (1) the signal intensity (SI) of the point prior to a primary event (Gd-PRIOR to EVENT; dotted line); (2) the change in SI from the 2 examinations prior to the primary event (Gd-INTERMEDIATE; dashed line); and (3) the change in SI from baseline to the point prior to the primary event (Gd-BASELINE to PRIOR EVENT; dash/dot line). As shown, changes in SI early in the study predicted future events.

