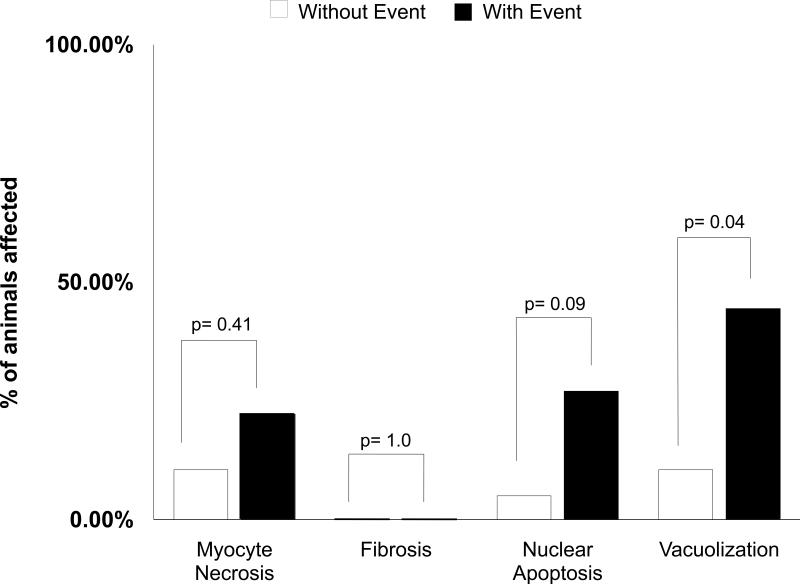
Figure 6. Myocardial morphology.
Bar graph displaying the percentage of animals which developed myocellular necrosis, fibrosis, apoptosis, and vacuolar degeneration. Animals experiencing the primary endpoint of death (n=3) or drop in left ventricular ejection fraction (n=13) exhibited more vacuolization relative to animals that did not experience these primary endpoints.

