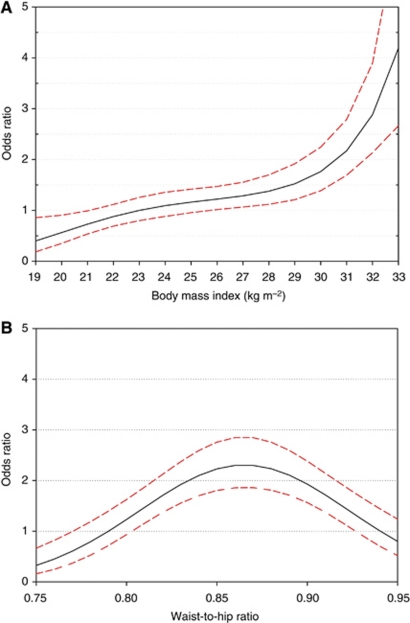
Figure 1.
Estimates of odds ratios and 95% confidence intervals of endometrial cancer by body mass index at diagnosis (A) and waist-to-hip ratio (B), using cubic regression splines. Italy, 1992–2006 (Odds ratios from regression equations include terms for age, study centre, year of interview, education, smoking status, age at menarche, age at menopause, oral contraceptives use, parity, and hormone replacement therapy use. Curves are shown for best-fitting cubic spline regression models according to Akaike Information Criterion. Dashed lines represent 95% confidence intervals. Ranges represent the distribution of variables among controls from 10th to 90th percentile). Reference categories were body mass index=23 and waist-to-hip ratio=0.79.

