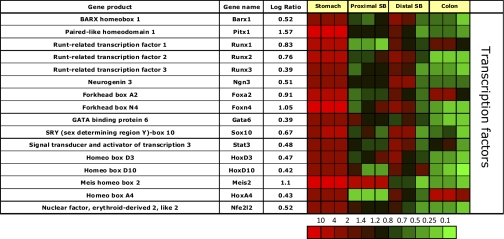
Fig. 7.
Segment-specific expression of genes coding for transcription factors. This figure illustrates the relative distribution of genes encoding transcription factors that are selectively expressed in epithelial cells of the gastric corpus in 3 independent experiments (log of the mean of 3 ratios ± SD). Ratios are presented as heat maps showing gradients of highest (red) to lowest (green). The color scale at the bottom indicates the expression ratios (fold-change).

