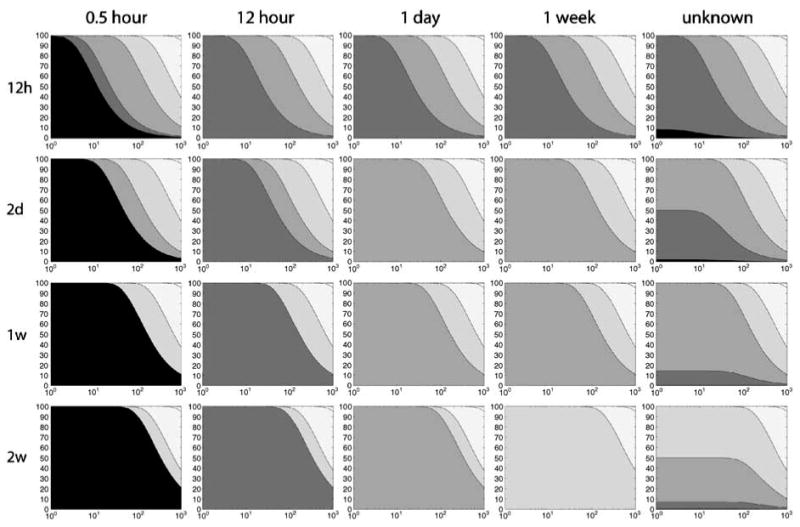
Figure 3.

Contribution of prior exposures to observed biomarker levels as a function of intake frequency, sampling time, and biochemical properties. The rows represent the time period of exposure (e.g. every 12 h, every 2 days, etc), the columns represent the time of sampling after the last exposure. For cases when sampling time is unknown, the mean values of the contributions are shown, assuming a uniformly random sampling time. The legend for the scales of gray is the same as in Figure 2.
