Figure 5.

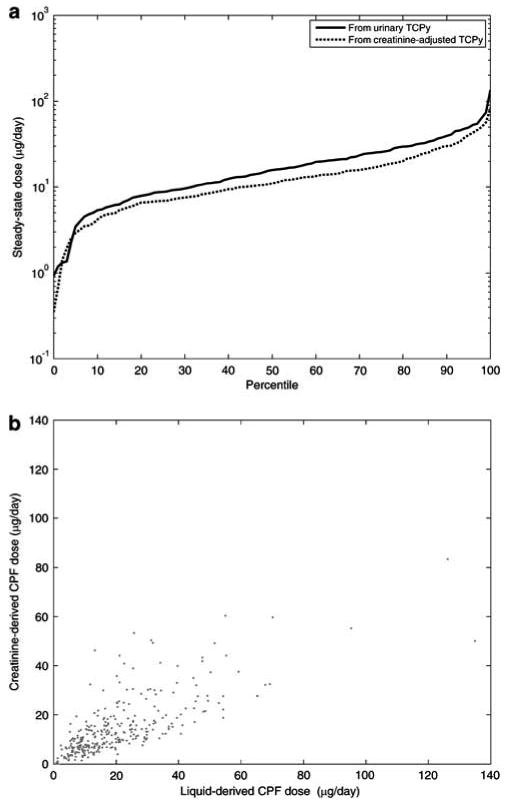
Comparison of predicted steady-state doses using creatinine-adjusted urinary TCPy biomarkers, and using liquid urinary concentration TCPy biomarkers: (a) cumulative distributions, and (b) scatter plot.

Comparison of predicted steady-state doses using creatinine-adjusted urinary TCPy biomarkers, and using liquid urinary concentration TCPy biomarkers: (a) cumulative distributions, and (b) scatter plot.