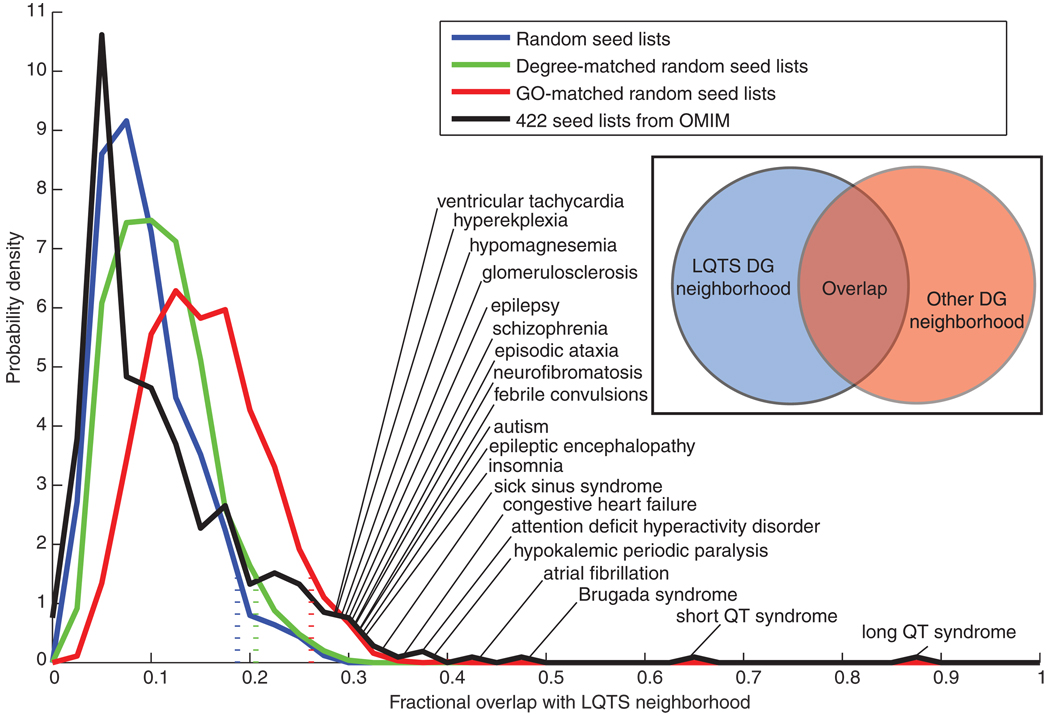
Fig. 3.
Distribution of fractional overlap of other subnetworks with the LQTS neighborhood. The LQTS disease gene neighborhood was compared to disease gene neighborhoods generated from various control seed lists. These seed lists consisted of 13 randomly selected nodes, 13 randomly selected nodes for which their degree of connectivity matched the LQTS seed list, or 13 randomly selected nodes with GO annotation for the terms membrane and cytoplasm in a proportion matching those in the LQTS seed lists. Four hundred and twenty-two seed lists, with variable numbers of seeds, were created from the OMIM database. Each disease-related seed list was used to generate a neighborhood by selecting all nodes that had a positive score after MFPT ranking. The distribution of fractional overlap with the LQTS neighborhood, number of nodes shared by both neighborhoods divided by total number of unique nodes in either neighborhood, is shown for each set of random networks. Dashed lines indicate where the overlap threshold below which 95% of the random networks in each distribution falls. The 20 diseases showing the most overlap with LQTS are labeled. The “long QT syndrome” network with 87% overlap is based on the 11 seed genes that were in OMIM.

