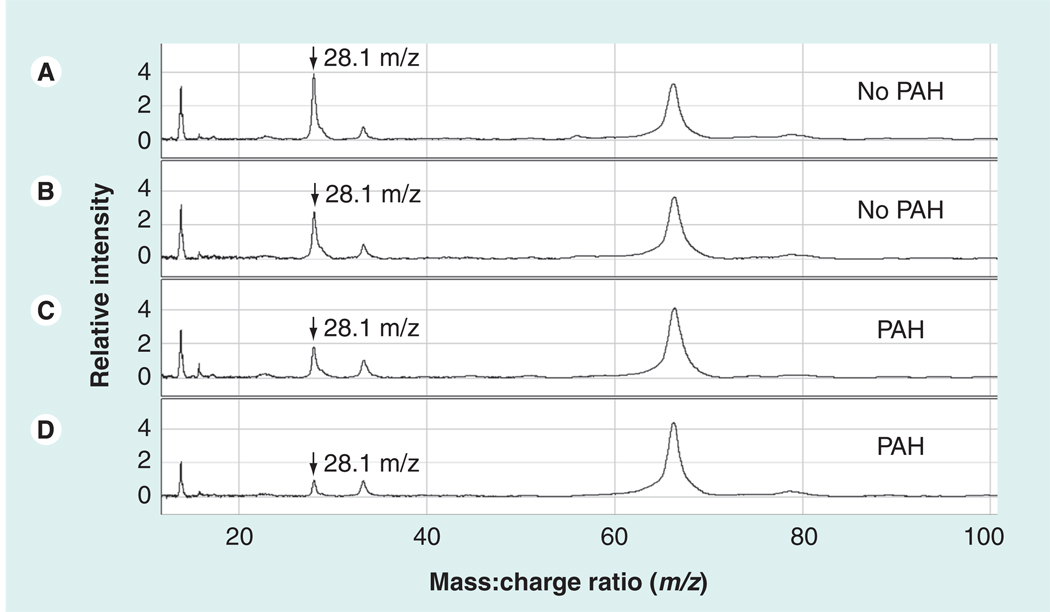
Figure 2. Representative SELDI-TOF MS spectra from plasma from patients with sickle cell disease with and without pulmonary hypertension.
The vertical axes represent intensity of peaks in arbitrary units, and the horizontal axes represent mass:charge ratio (m/z). These four spectra were obtained from plasma eluted from anion exchange resin, bound to IMAC30–Cu2+ matrix, and ionized by SELDI-TOF MS. Two specimens are from sickle cell disease (SCD) patients without pulmonary arterial hypertension (A & B) and two are from SCD patients with PAH (C & D). A peak at m/z 28.1 kDa was observed at lower average intensity in SCD patients with PAH (arrows). IMAC: Immobilized metal-affinity capture; PAH: Pulmonary arterial hypertension. Reproduced with permission from [56].

