Fig. 1.
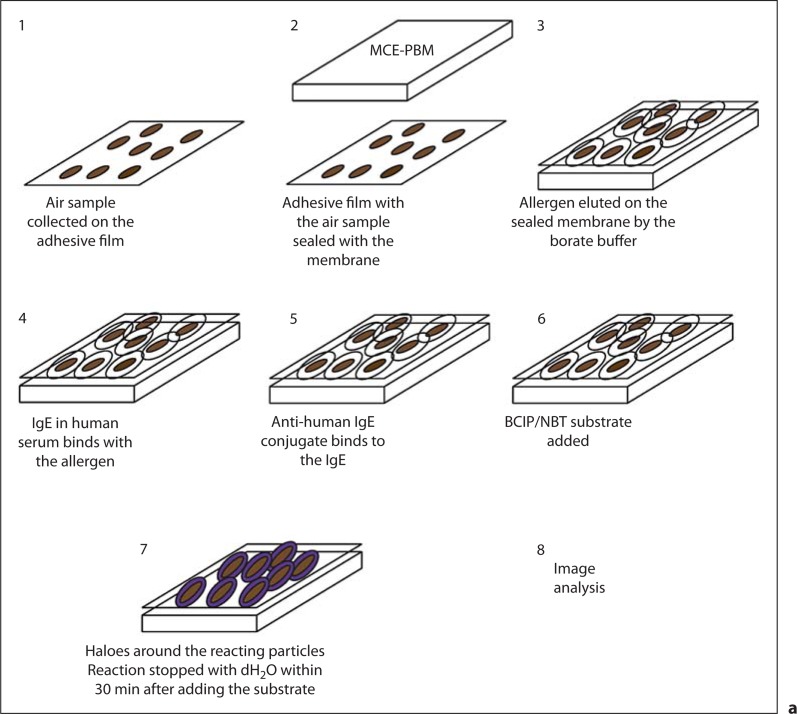
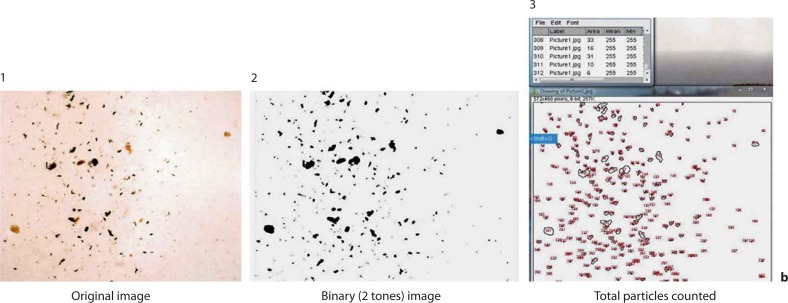
a Numbered diagram of the halogen immunoassay, adopted from that of Green et al. [35], with the modification that the air sample is collected on the adhesive tape. b Numbered diagram with the sequence of images obtained when counting the total particulates. b1 is the original image, and b2 is the image converted to a binary image (2-tone) with ImageJ, in which the color of all particles present on the image was changed to only black and the background is all white to facilitate the total particle count by the software. After the smallest and largest pixel area and circularity ranges were set, the total particles were counted with ImageJ as is shown in b3. Notice that the particles in all 3 images are in the same location.


