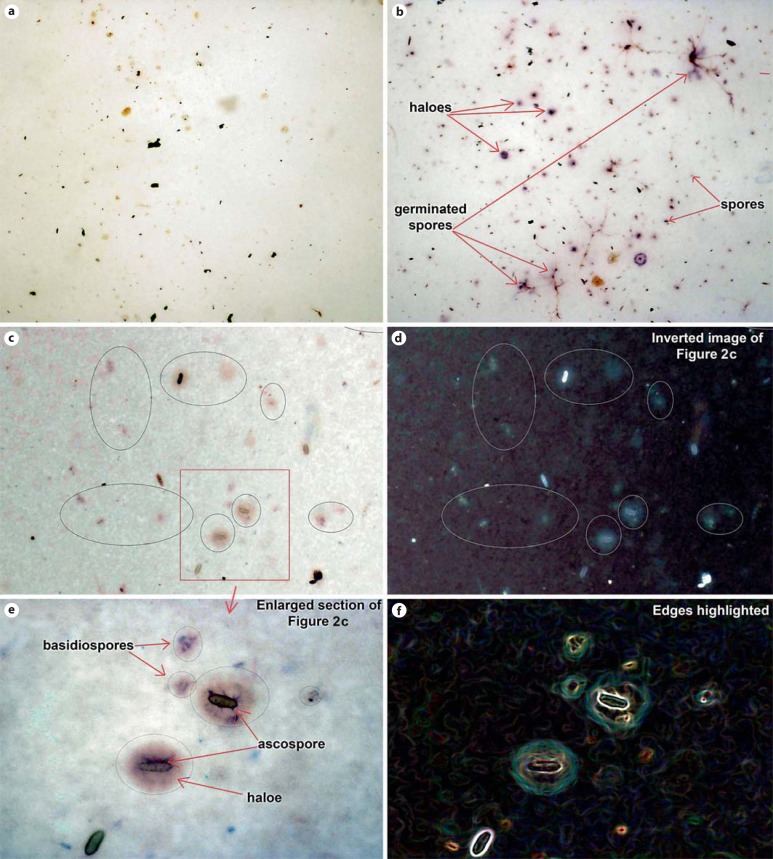
Fig. 2.
a Halogen assay image with negative results (no haloes). b Halogen assay image with positive results. c Image with haloed particles serving as an example to demonstrate the 3 image adjustments used to confirm and identify the reactive particles. d Inverted image. e Sections of the image enlarged 400% with Adobe Photoshop with the Blow-up plug-in. f Highlighted edges of the particles that were hidden by the halo.

