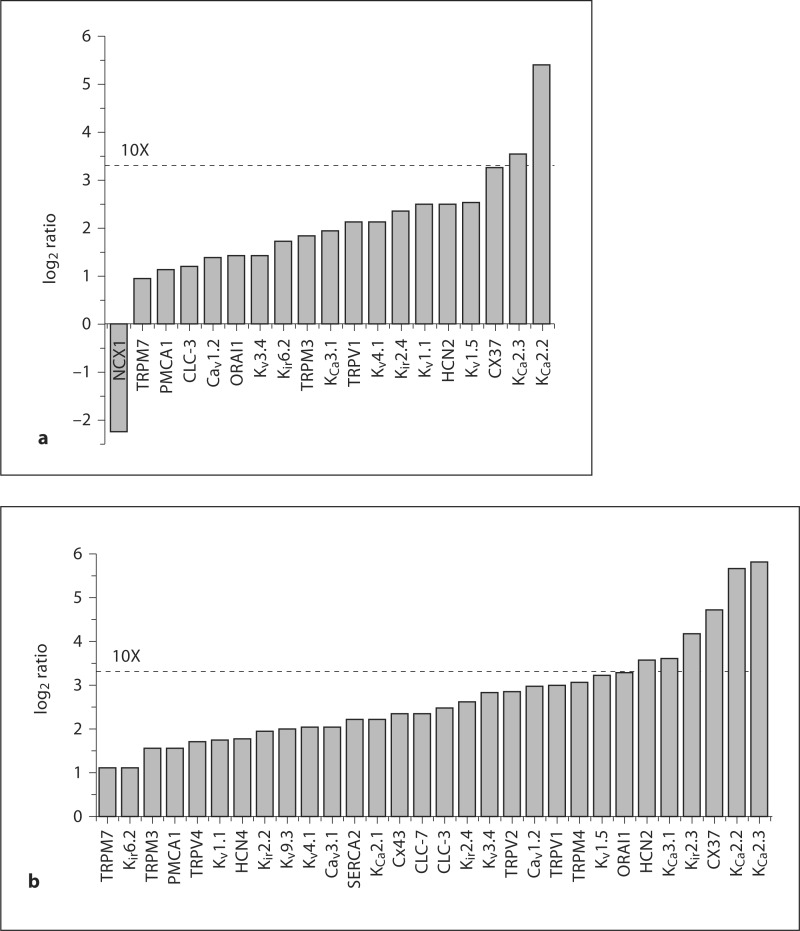
Fig. 2.
Shear-induced changes in ion channel subunit expression levels. Only the genes that were found to be significantly differentially expressed (by SAM analysis) are shown. HCAECs were exposed to shear force of 5 dyn/cm2 (a) or 15 dyn/cm2 (b). qRT-PCR was performed and expression levels were calculated relative to reference genes. Shown are the ratios (after log2 transformation) of the expression levels under flow compared with the expression levels under static (control) conditions.

