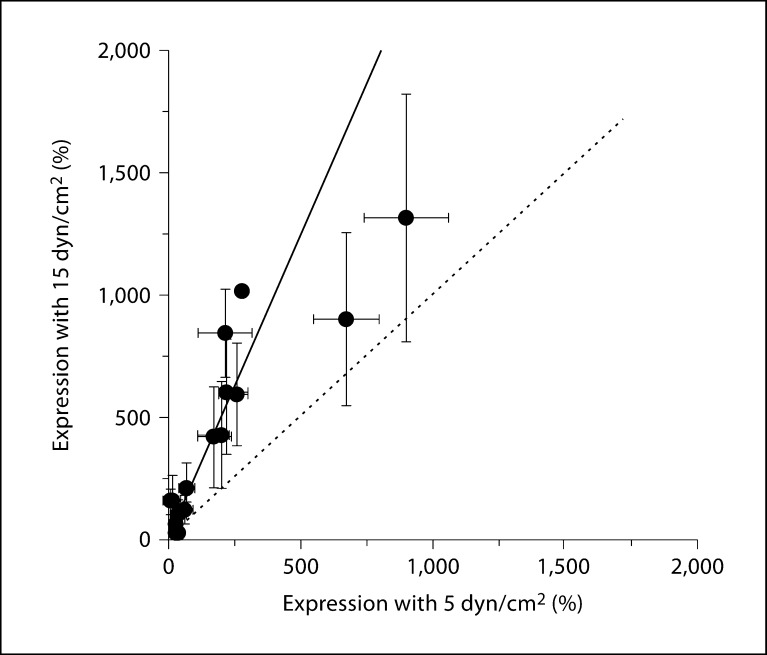
Fig. 4.
Relationship between two different applied shear forces on mRNA expression. The mRNA expression levels of 54 ion translocator subunits, relative to the reference genes, were determined at 24 h applied shear of 5 or 15 dyn/cm2 (expression values relative to reference genes after log2 transformation, same data as in fig. 3). For each subunit, the expression levels at the two shear conditions are plotted as a function of the other. The solid line represents a least-squares fitting of a straight line to the data (slope = 2.4, intercept forced through zero). For comparison, the dotted line indicates a line with unity slope.

