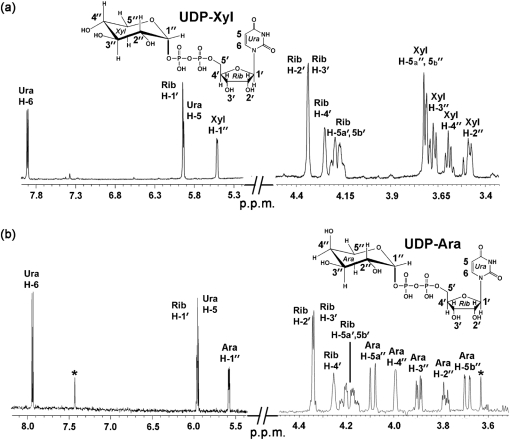
Fig. 3.
1H-NMR spectroscopic analyses of the UDP-α-d-xylose and UDP-β-l-arabinose formed by SmUxs1 and SmUxe, respectively. (a) The peak (Fig. 2b, panel 2, marked by an asterisk) corresponding to the product formed by SmUxs1 was collected and analysed by 1H-NMR spectroscopy at 600 MHz. Portions of the NMR spectrum between 3.4–4.5 and 5.2–8.0 p.p.m. are shown. The assigned signals have the symbol H for the uracil protons (Ura), the symbol H′ for the ribose (Rib) protons, and the symbol H″ for the xylose (Xyl) protons. (b) The Uxe enzymic product (Fig. 4b, panel 2, marked with an asterisk) was collected from the column, lyophilized and analysed by 1H-NMR at 25 °C. The 600 MHz NMR spectrum of the product is shown between 3.5–4.5 and 5.4–8.2 p.p.m. The assigned signals have the symbol H for the uracil protons (Ura), the symbol H′ for the ribose (Rib) protons, and the symbol H″ for the arabinose (Ara) protons.

