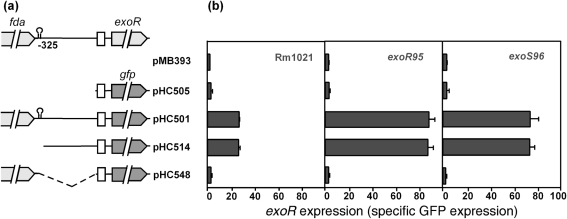
Fig. 1.
(a) Schematic representation of the exoR gene region in S. meliloti. Solid bars indicate the exoR promoter regions in the constructs and the dashed line represents the region that was not included. The box indicates the RBS and the hairpin indicates the transcription terminator. (b) exoR promoter activities of different constructs in the wild-type Rm1021 and in exoR95 and exoS96 mutants. Specific GFP expression was determined by normalizing GFP fluorescence intensity to cell density (OD600) and used to represent exoR promoter activity. Data are means±ranges from two independent experiments.

