Fig. 5.
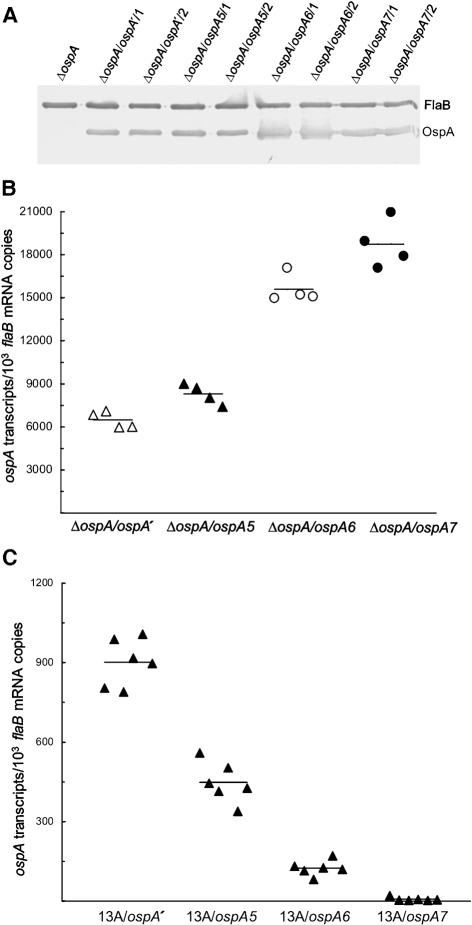
Confirmation of the role of cisI and cisII in enhancing ospA expression in vitro but reducing expression in vivo. (A) Restoration of OspA synthesis resulting from introduction of pBBE22-ospA5, pBBE22-ospA6 or pBBE22-ospA7. ΔospA, ΔospA/ospA′/1, ΔospA/ospA′/2, ΔospA/ospA5/1, ΔospA/ospA5/2, ΔospA/ospA6/1, ΔospA/ospA6/2, ΔospA/ospA7/1 and ΔospA/ospA7/2 spirochaetes were harvested at late-exponential phase and subjected to immunoblot analysis, probed with a mixture of FlaB and OspA mAbs. (B) Confirmation of the role of cisI and cisII in enhancing ospA expression in vitro. ΔospA/ospA′/1, ΔospA/ospA′/2, ΔospA/ospA5/1, ΔospA/ospA5/2, ΔospA/ospA6/1, ΔospA/ospA6/2, ΔospA/ospA7/1 and ΔospA/ospA7/2 spirochaetes were harvested at late-exponential phase in duplicate. RNA was extracted and analysed for ospA and flaB mRNA accumulation by RT-qPCR. The expression activity is presented as ospA mRNA copy numbers per 103 flaB transcripts and compared in four groups by combining the subgroups ΔospA/ospA′/1 and ΔospA/ospA′/2, ΔospA/ospA5/1 and ΔospA/ospA5/2, ΔospA/ospA6/1 and ΔospA/ospA6/2, and ΔospA/ospA7/1 and ΔospA/ospA7/2. The mean copy numbers (horizontal lines) for each group are also presented. (C) Confirmation of the contributions of cisI and cisII to the downregulation of ospA expression in vivo. Subgroups of three mice were inoculated with clone 13A/ospA′/1, 13A/ospA′/2, 13A/ospA5/1, 13A/ospA5/2, 13A/ospA6/1, 13A/ospA6/2, 13A/ospA7/1 or 13A/ospA7/2 and euthanized 1 month later. RNA was extracted from skin specimens and quantified for flaB and ospA expression by RT-qPCR. Data are presented as ospA transcripts per 103 flaB mRNA copies in four groups (genotypes including 13A/ospA′, 13A/ospA5, 13A/ospA6 and 13A/ospA7). The means (horizontal lines) for each group are also presented.

