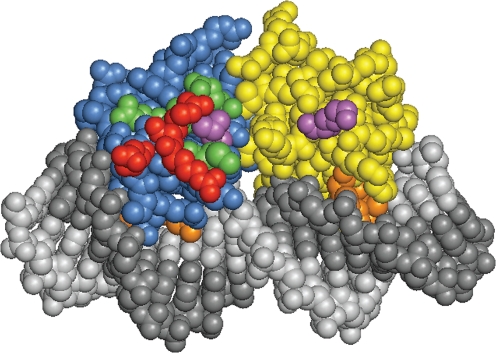
Fig. 3.
X-ray model of a NarL-CTD dimer in complex with its DNA-binding site from the nirB operon control region; from Maris et al. (2005). The two protomers are coloured blue and gold, and the two DNA strands are shaded light and dark grey. Residues are highlighted according to their phenotype: PC, red (Arg-178, Arg-179, Asp-181); functional, green (Asp-162, Leu-166, Gln-169, Met-175); deficient, violet (Leu-171, Lys-199); DNA-binding, orange (Lys-188, Val-189, Lys-192).

