
Fig. 2.
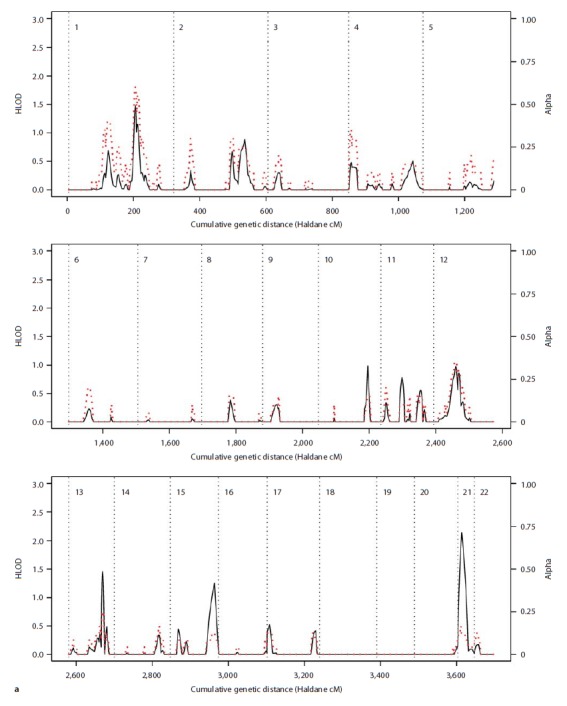
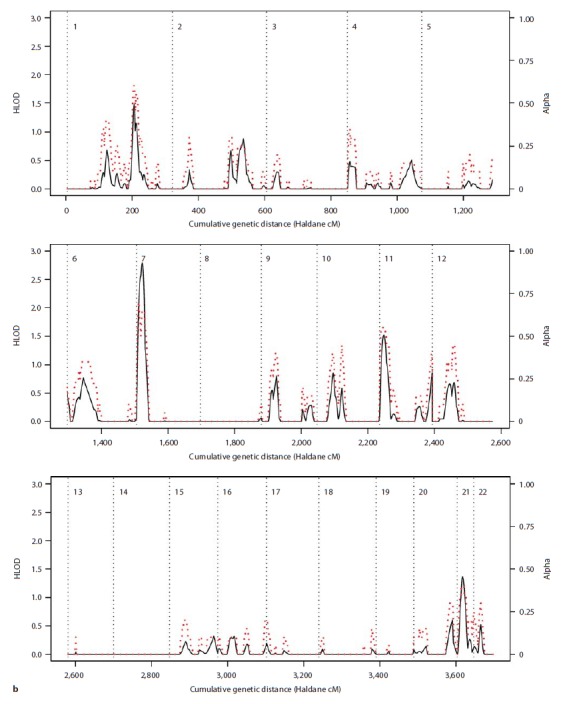
Results of the parametric linkage analysis under the narrow diagnostic model and near-dominant (a) and recessive (b) inheritance models. Multipoint HLOD scores (solid black line) and the estimated proportion of linked families (α; dotted red line) are plotted against the cumulative genetic distance in Haldane cM. Chromosomes are separated by dotted black lines.