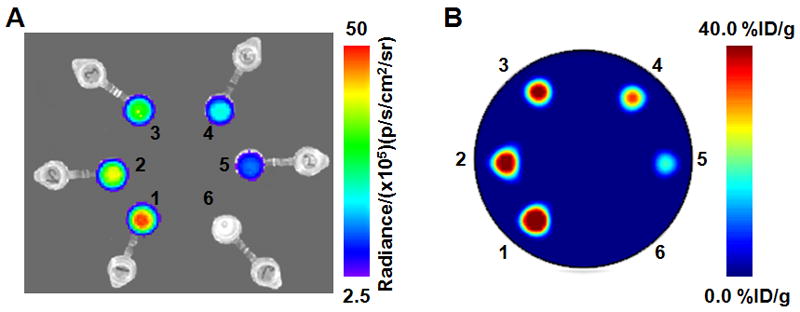
Figure 1.

Phantom images recorded using optical (CLI) imaging (A) and PET (B) of 6 samples of 89Zr activity in water. At time 0 h, the Eppendorf tubes labeled 1–6 corresponded to activity concentrations of 40.3, 32.6, 27.4, 20.4, 13.3 and 0.00 kBq/μL. Optical images were recorded by using an integration time of 30 s and f/stop 1.
