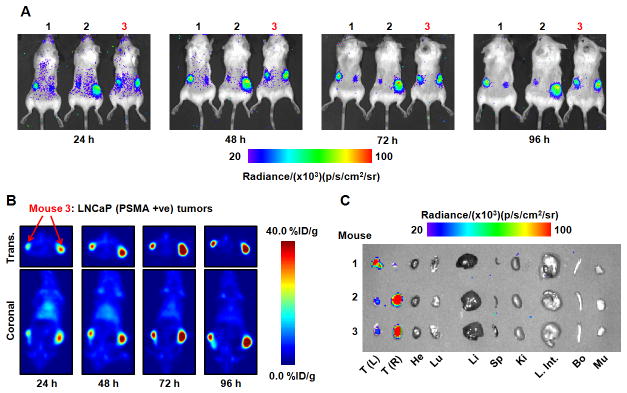
Figure 4.
Temporal images of 89Zr-DFO-J591 uptake (10.9–11.3 MBq, [295–305 μCi], 60–62 μg of mAb, in 200 μL 0.9% sterile saline) recorded in dual subcutaneous LNCaP (PSMA-positive) tumor-bearing Severe combined immune deficient mice between 24 and 96 h after administration. (A) signal observed in the optical spectrum from in vivo CLI of 89Zr-DFO-J591 tumor uptake in 3 mice. (B) Corresponding coronal and transverse immuno-PET images recorded for mouse 3. (C) Optical image recorded of the organs after acute ex vivo biodistribution at 96 h. Transverse and coronal planar immuno-PET images intersect center of tumors. Upper and lower thresholds of CLI and immuno-PET images in A-C have been adjusted for visual clarity, as indicated by scale bars. Trans. = transverse; +ve = positive; T(L) = left tumor; T(R) = right tumor; He = heart; Lu = lungs; Li = liver; Sp = spleen; Ki = kidneys; L. Int. = large intestine; Bo = bone; Mu = muscle.

