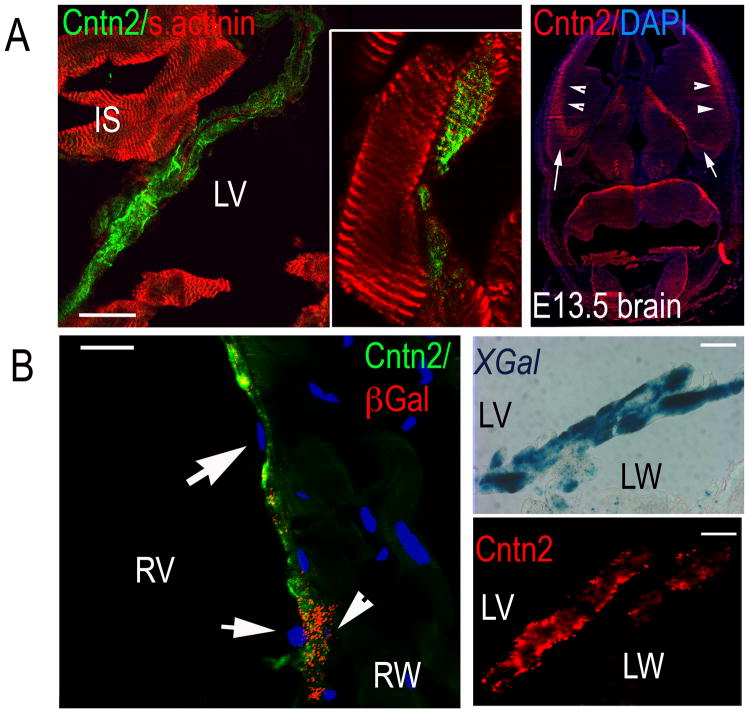
Fig. 2. Cntn2 is specifically expressed in Purkinje fibers.
(A Left) Confocal image of mouse heart sections confirming that Cntn2+ cells (green) express the cardiac marker sarcomeric actinin (red, Left). (Inset) High power image showing an optical slice of a Cntn2+/sarcomeric actinin+ myocyte. (B Left) Epifluorescent images of CCS-lacZ hearts showing a Cntn2+/βGal+ (green/red) cell (arrowhead) under a layer of Cntn2−/βGal− endocardial cells (arrows). (B Right) Images of CCS-lacZ heart serial sections stained for XGal (Upper) and Cntn2 (red, Lower) showing co-localization of Cntn2 and the PF-specific marker CCS-lacZ. (C) Epifluorescent image of E13.5 mouse brain used as positive control, showing Cntn2 expression (red) in the intermediate and marginal zones (arrowheads) and in the preplate region (arrows) of the ventral telenchephalon. LW, left ventricular wall; LV, left ventricle; RW, right ventricular wall; RV, right ventricle. Size bars: 20μM. A Left, Inset: 35μM.

