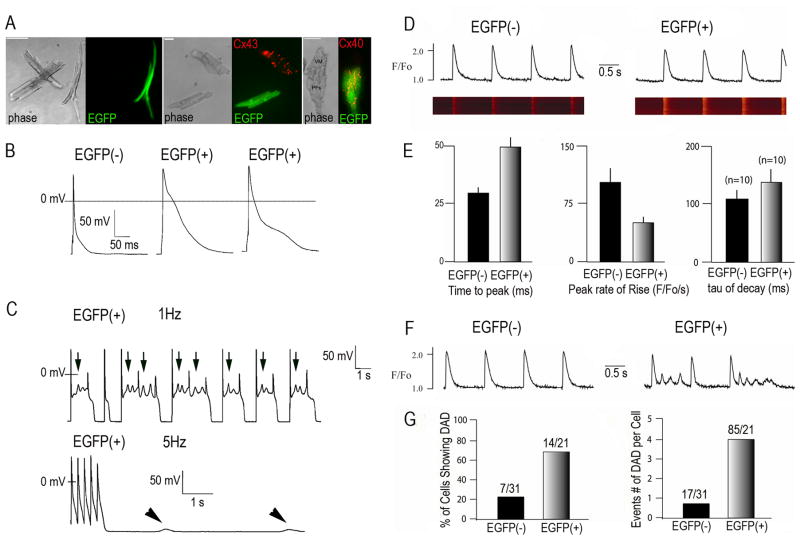
Fig. 5. Analysis of electrophysiological features of Cntn2-EGFP+ cells.
(A) Representative phase contrast and corresponding epifluorescence micrographs of dissociated myocytes from Cntn2-EGFP transgenic hearts. Cntn2-EGFP+ cells can be differentiated from surrounding cardiac myocytes by their rod-shaped morphology (Left) and their Cx43− (Center), Cx40+ (Right) phenotype. (B) Representative whole cell recordings of action potentials from Cntn2-EGFP− and Cntn2-EGFP+ cells. (C) APs from Cntn2-EGFP+ myocytes demonstrated spontaneous electrical oscillations in phase 2 which resulted in EADs (Top, arrows), at lower pacing rates (1Hz), and DADs (Bottom, arrowheads), at higher pacing rates (5Hz). (D) Line-scan fluorescence images and corresponding fluorescence profiles generated by Ca2+ transients in Cntn2-EGFP+ (Right) and Cntn2-EGFP− (Left) myocytes. (E) Comparison of kinetic parameters corresponding to Ca2+ transients in Cntn2-EGFP+ and Cntn2-EGFP− myocytes. (F) Line plots (G) and graphs showing that Cntn2-EGFP+ myocytes displayed a higher frequency of unstimulated Ca2+ events arising from DADs compared to Cntn2-EGFP− myocytes. EAD, early afterdepolarization; DAD, delayed afterdepolarization; AP, action potential. N=number of cells analyzed. VM, ventricular myocyte; PF, Purkinje Fiber; APs, action potentials; EADs, early afterdepolarizations; DADs, delayed afterdepolarizations.

