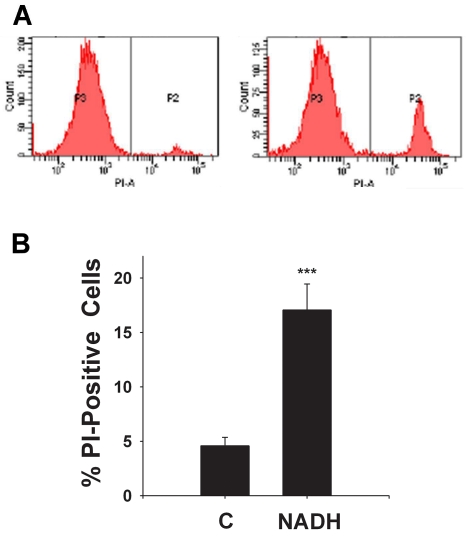
Figure 2.
(A) The graphs from flow cytometry-based PI assays showed that NADH treatment induced an increase in the number of PI-positive C6 glioma cells. The P2 fraction and the P3 fraction indicate the number of PI-positive cells and PI-negative cells, respectively. The number of PI-positive cells in the samples treated with 1000 μM NADH is greater than that in the controls. (B) Quantifications of the results from the flow cytometry-based PI assays showed that NADH treatment induced a significant increase in the number of PI-positive C6 glioma cells. The cells were treated with 1000 μM NADH for 24 hrs, and subsequently the number of PI-positive cells was assessed by flow cytometry-based PI assay. N = 9. Data were pooled from 3 independent experiments. ***, p < 0.001.

