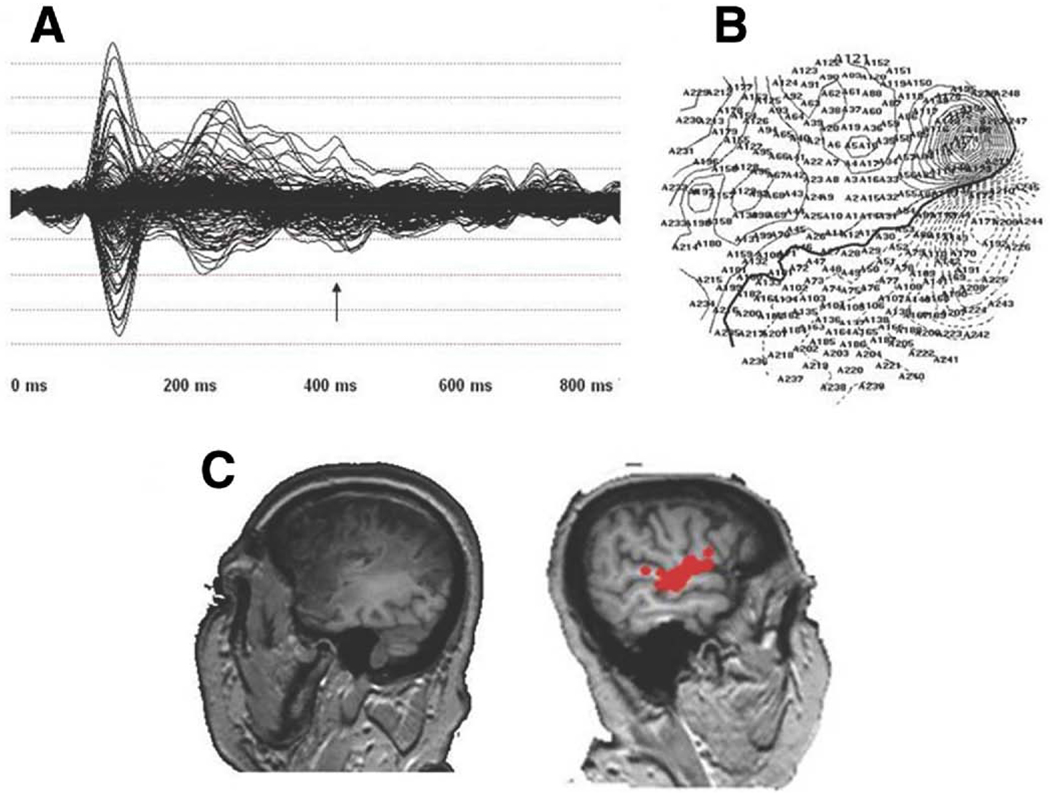
Fig 1.
(A) The averaged waveform for a single run for a single patient for all sensors, (B) isofield contour map at 420 milliseconds for the patient, and (C) thresholded dipoles between 150 milliseconds and 800 milliseconds in the left (left side of image) and right (right side of image, red circles) hemispheres.

