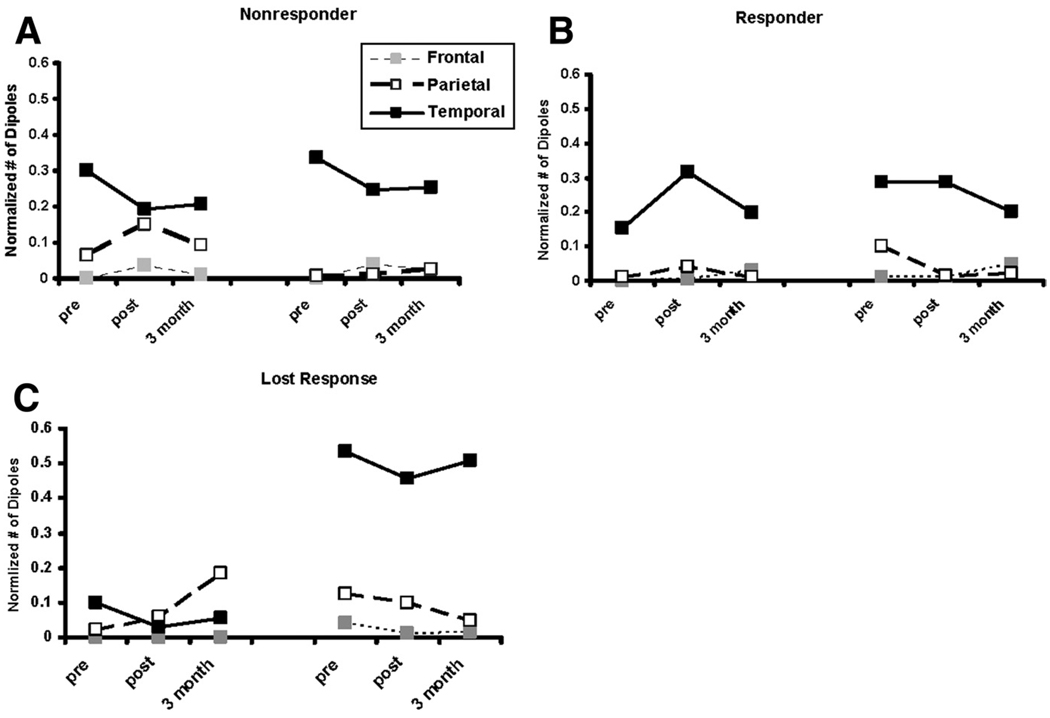
Fig 3.
Mean normalized late MEG activation in the frontal (dotted lines, gray boxes), parietal (dashed lines, white boxes), and temporal (solid lines, black boxes) lobes in the left (left side of each graph) and right (right side of each graph) hemispheres at the pre- and post- CILT and 3-month follow-up scanning sessions for the (A) non-responder, (B) responder, and (C) lost-response groups.

