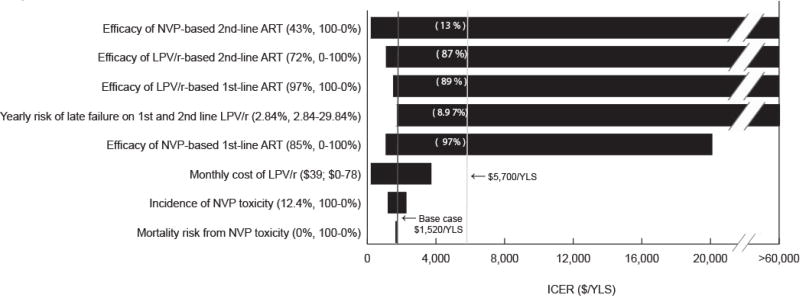
Figure 1.
NVP: nevirapine; ART: antiretroviral therapy; LPV/r: lopinavir/ritonavir; ICER: incremental cost-effectiveness ratio; YLS: year of life saved
A “tornado diagram” summarizes the results of a series of 1-way sensitivity analyses. Key model parameters are listed on the vertical axis. For each parameter, the value used in the base case analysis and the range examined in sensitivity analyses are listed in parentheses. The horizontal axis represents cost-effectiveness ratios for 1st-line LPV/r compared to 1st-line NVP. Each horizontal bar represents the range of cost-effectiveness ratios produced by varying model parameter across the ranges shown. The solid vertical line denotes the base case cost-effectiveness ratio estimate ($1,520/YLS, and the dashed vertical line denotes the cost-effectiveness ratio of $5,700 (2008 South African GDP) per YLS. Numbers in parentheses above each horizontal bar indicate the threshold value of each parameter at which the cost-effectiveness ratio for 1st-line LPV/r compared to nevirapine becomes <$5,700/YLS. The horizontal axis should be understood to extend to the right beyond $60,000/YLS and to include instances when 1st-line LPV/r costs more and dominates 1st-line NVP (as is the case when 2nd-line LPV/r efficacy is ≥90%). Bars abutting the far left margin indicate situations in which 1st-line LPV/r costs less and confers more life-years than 1st-line NVP, or in which 1st-line NVP is dominated (see Table 4, footnote b).

