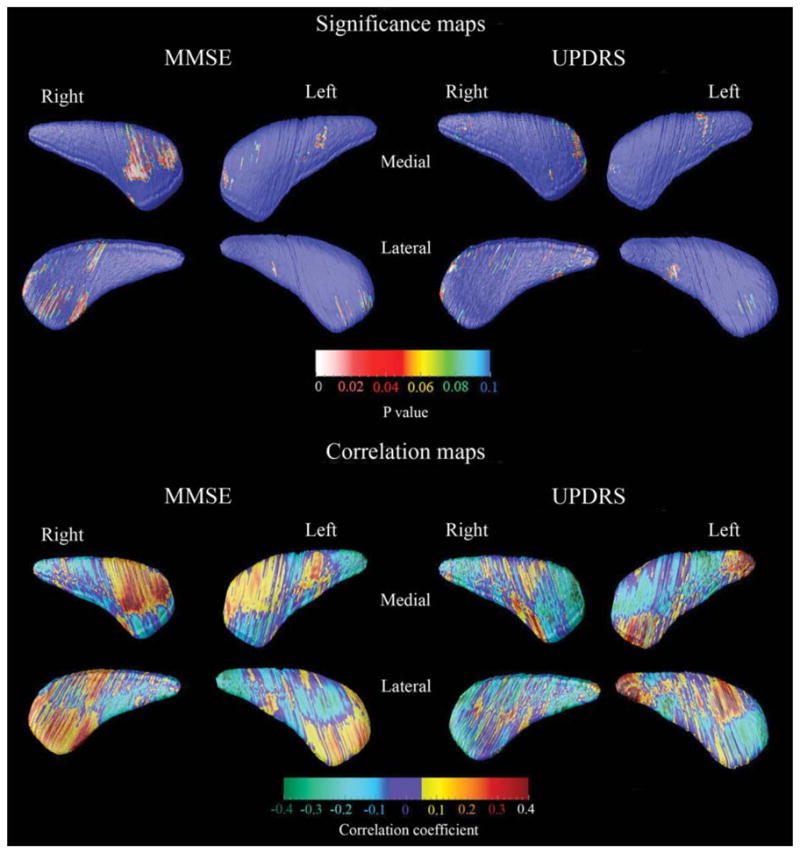
FIG. 3.

3D caudate clinical covariate maps. For the significance maps (top two rows) the red and white colors denote areas where the P-value is equal to or less than 0.05 and the dark blue colors denote P-values of 0.1 or higher. The correlation maps (bottom two rows) show the strength of the correlations between radial distance (or caudate thickness) and MMSE or UPDRS Part III:motor subscale at each surface point of the caudate model.
