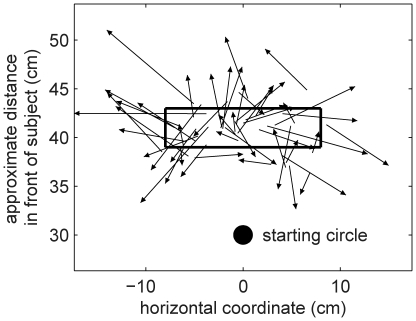
Figure 2. Target area and example perturbation vectors.
The starting point of the reaches (1 cm radius circle) and the area from which the centres of targets were drawn ( cm rectangle: not displayed to the subject) are shown, in addition to ‘perturbation vectors’ from subjects' hand positions to the corresponding cursor positions on the first trials of 50 example transformations from Session 1.

