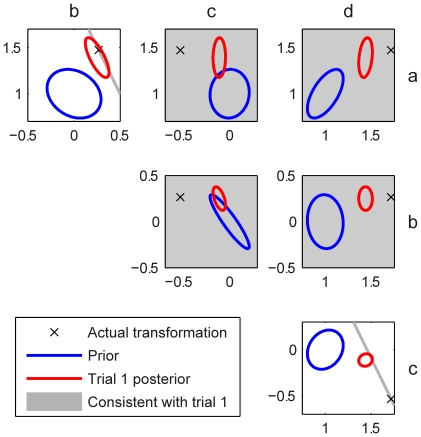
Figure 4. Schematic of the Bayesian observer model.
The plots show six 2-dimensional views of the 4-dimensional probability space of the  ,
,  ,
,  &
&  parameters of the transformation matrix. The Gaussian prior is shown in blue (marginalised 1 s.d. isoprobability ellipses). On the first trial the evidence the subject receives (for simplicity shown here as noiseless) does not fully specify the transformation uniquely, and the transformations consistent with this evidence are shown in gray. This evidence (as a likelihood) is combined with the prior to give the posterior after the first trial (red ellipses: these are shown calculated from the noisy visual feedback) and the MAP of this posterior is taken as the estimate of the transformation. The cross shows the position of the actual transformation matrix used in generating the first-trial evidence.

