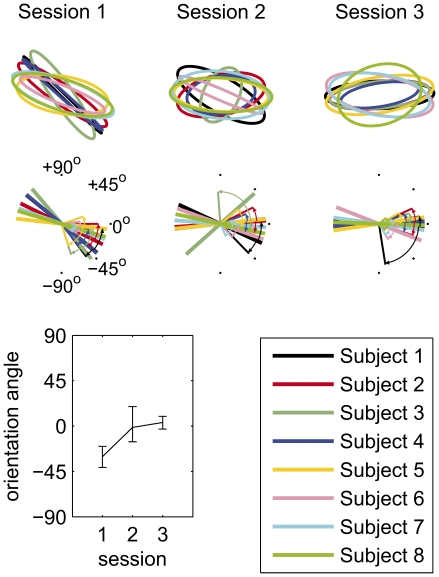
Figure 6. Evolution of the b-c relationship.
The top line shows the best fits in each of the experimental sessions, for each of the eight subjects; the middle line shows means and confidence limits on the covariance orientation angles. The bottom-left graph shows the mean across subjects of the orientation angles from the best fits to each subject's data, with 95% confidence limits on the mean found by bootstrapping.

