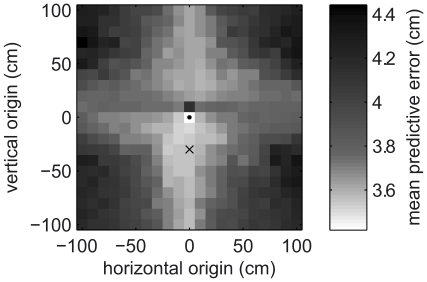
Figure 8. Comparison of possible linear transformation origins for the Bayesian observer model.
For each small square the shading denotes the performance of the standard Bayesian observer model when the origin of the linear transformations is set to the centre of that square. Performance is measured using the error between modelled and measured second-trial hand positions, averaged within an experimental session for one subject (after capping all errors at 20 cm) and then averaged across all subjects and all sessions. The small circle shows the start point of the reaches, which is used as the origin in all other modelling. The cross shows the approximate position of the eyes ( cm).
cm).

