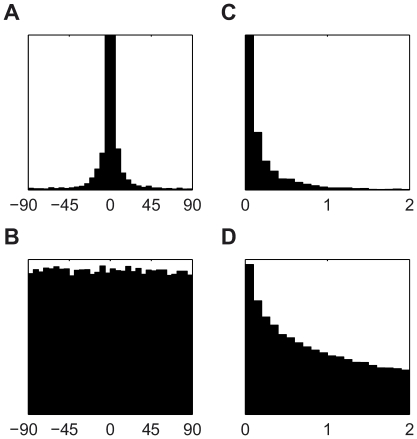
Figure 9. Model validation.
(A) The distribution of the difference in covariance orientation angle between pairs of elements in the generating and fitted priors, aggregated across all six pairings of elements. (B) The corresponding distribution when random priors are compared. (C) The distribution of the absolute difference in correlation coefficient between pairs of elements in the generating and fitted priors, aggregated across all six pairings of elements. (D) The corresponding distribution when random priors are compared.

