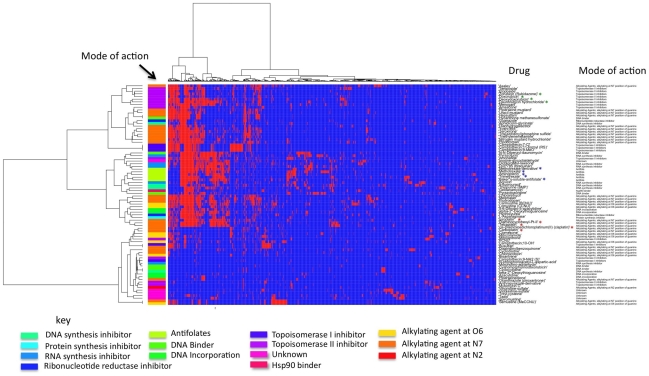
Figure 4. Clustering drugs according to the pathways significantly correlated to sensitivity.
Red and blue indicates a pathway which is or is not significant in the inter-omic analysis. A significance level of p<0.05 was used for each pathway. Clustering was performed using complete linkage and the Hamming distance metric. Pathways not associated with any drug have been omitted from the figure. Red asterisks indicate platinum drugs, blue asterisks indicate antifolates and green asterisks indicate anthracycline-based drugs.

