
Figure 7.
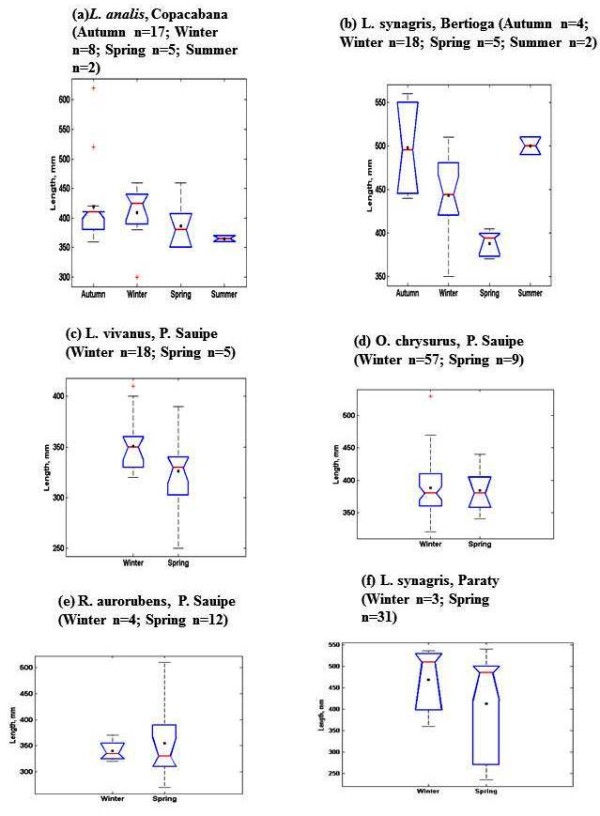
Length distributions for species of the Lutjanidae family in different seasons of the year. Samples were taken in April 2008-January 2009. black dot - mean value; top and bottom of lines - maximum and minimum values; above and under the line of blue figure - 75th and 25th percentiles; red line - median; red cross - stray values.