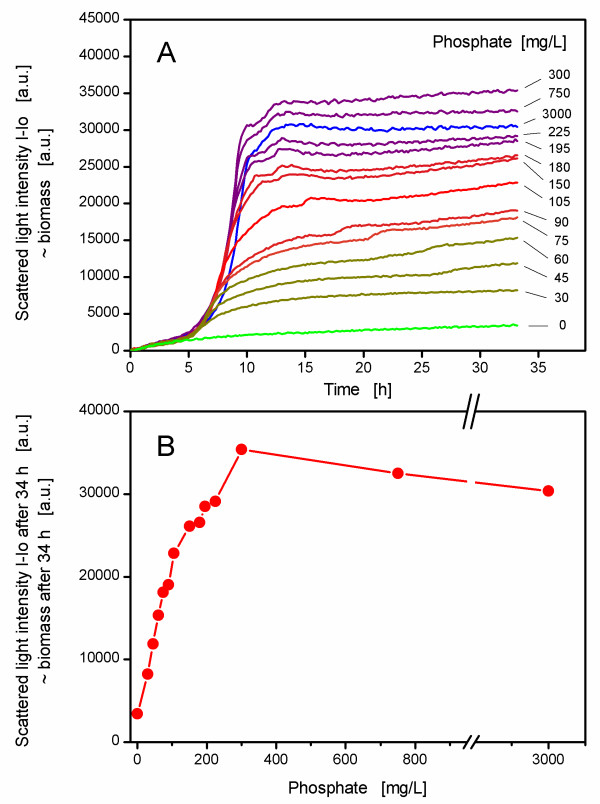
Figure 2.
Determination of phosphate demand of E.coli BL21(DE3) pRhotHi-2-EcFbFP via batch experiments in different media. The colored curves in panel (A) represent the mean values (n = 6) of cultures grown in media (modified Wilms & Reuss medium with 7.5 g/L glucose) containing phosphate from zero to 3000 mg/L. The relative standard deviation of each curve did not exceed ± 10%. The cultivation conditions were as follows: 37°C, shaking diameter 3 mm, shaking frequency 950 rpm, filling volume 200 μL, no inducer was added. The measurements were conducted with the BioLector prototype with a signal gain factor of 30. Panel (B) depicts the biomass after 34 h of growth as a function of the applied phosphate concentration in the medium (data taken from experiment shown in panel A).

