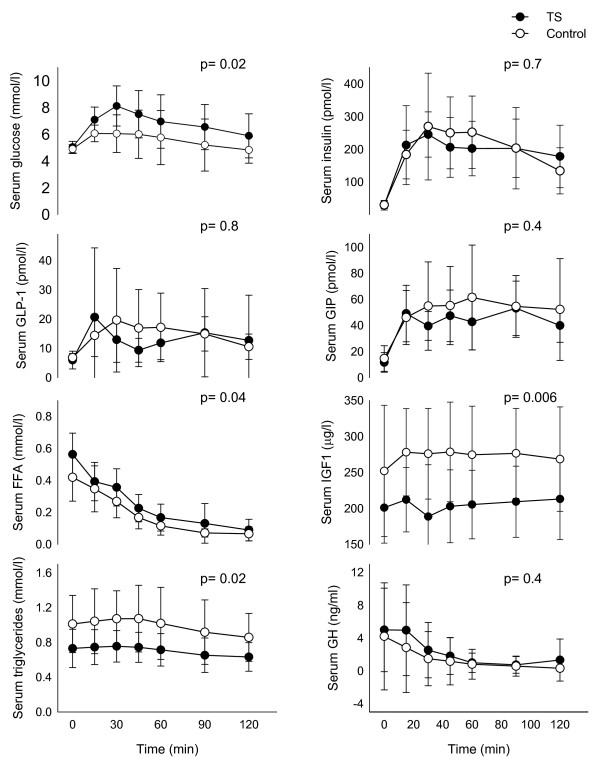
Figure 2.
Levels of glucose, insulin, glucagon-like. peptide-1 (GLP-1), glucose-dependent insulinotropic polypeptide (GIP); free fatty acids (FFA), triglycerides, Insulin-like growth factor 1(IGF-1) and growth hormone (GH) during the 2-hour oral glucose tolerance test. P-values are based on differences between TS and controls based on AUC and given in the figure. All mean ± SD.

