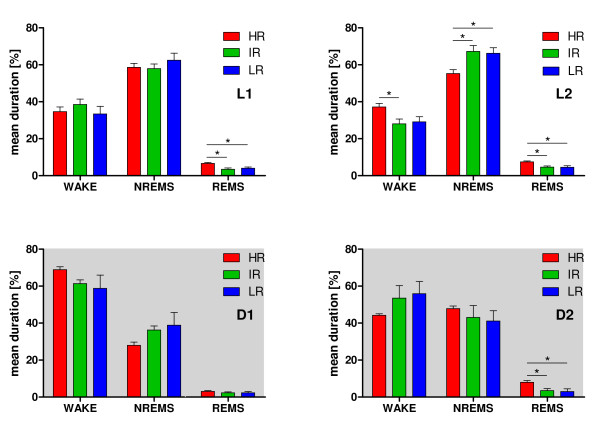
Figure 1.
Mean duration of vigilance states in high reactivity (HR), intermediate reactivity (IR) and low reactivity (LR) mice. The relative amounts of WAKE, NREMS and REMS are plotted in the panels L1 (light period 1, ZT0-6), L2 (light period 2, ZT6-12), D1 (dark period 1, ZT12-18, dark background) and D2 (dark period 2, ZT18-23, dark background). All three mouse lines display a typical circadian distribution of the vigilance states with significant differences observed in the HR line compared to IR and LR mice. Statistical differences between the mouse lines are indicated by asterisks ((*), Bonferroni modified LSD tests, p < 0.05). Data are given as means ± SEM.

