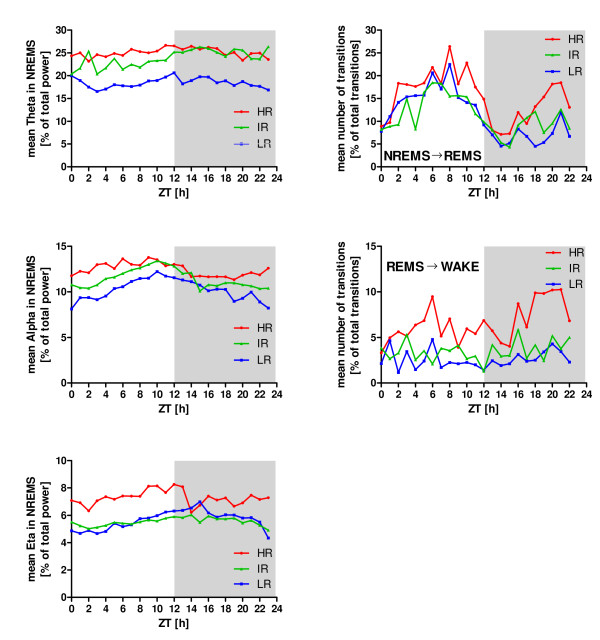
Figure 4.
Stability of progressions over time in HR, IR and LR mice. Left column: The curve progressions of group means of normalized power (expressed in percent of the total power) are plotted separately for each breeding line during L1, L2, D1 and D2. The mean theta power and mean alpha power of the LR animals clearly showed a stable progression significantly below the mean of both frequency bands in HR and IR mice across the whole experimental time period. Right column: The number of transitions from NREMS to REMS and from REMS to WAKE in HR mice are significantly and robust above the transitions of IR and LR animals. Data are given as means without SEM for reasons of clarity.

