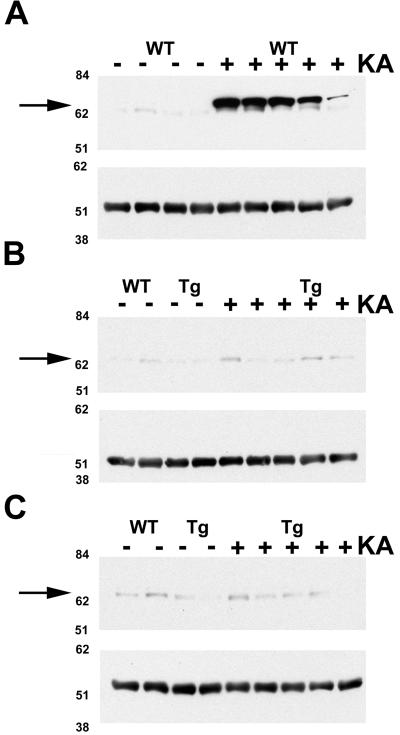
Figure 5.
Immunoblots using anti-Hsp70 antibody indicate that KA administration induces Hsp70 in WT mice (A), but not in SUR1 Tg174 (B) or Tg166 (C) mice. The hippocampus was dissected from WT and SUR1 Tg mice 24 h after injection of 25 mg/kg KA. Each lane contains 30 μg of total hippocampal protein from a single mouse. Molecular weight standard positions are displayed on the left, and arrows indicate the band corresponding to Hsp70. (A–C Lower) α-Tubulin bands are shown. Minus and plus signs denote saline- and KA-treated mice, respectively.

