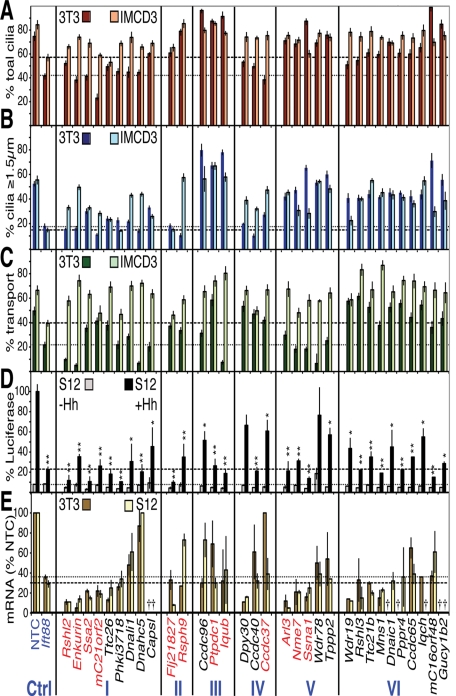
FIGURE 2:
Primary screen results for the 32 candidate siRNAs with ciliary phenotypes. The results of the three functional assays are plotted in categories according to the resulting phenotypes (classes listed at the bottom). (A) Ciliation phenotypes. The percentage of cells bearing any cilium (including ciliary dots) in 3T3 (rusty red) and IMCD3 HTR6-GFP (beige) cells. The means ± standard deviations (SDs) of three different sets of cilia from a single experiment are plotted. (B) Cilia length phenotypes. The percentages of cells with cilia at least ≥1.5 μm in length (i.e., longer than ciliary “dots”) are plotted for 3T3 (dark blue) and IMCD3 HTR6-GFP (light blue) cells. The means and SDs from the same images scored in (A) are shown. (C) Ciliary cargo transport phenotypes. The ≥1.5-μm-long cilia in (B) were scored for the percentage (mean ± SD) with strong cilia tip Gli3 in 3T3 cells (dark green) or ciliary HTR6-GFP in IMCD3 cells (light green). Dotted and dashed lines in A–C highlight the positive control siIft88 3T3 and IMCD3 percentages, respectively. (D) Hh signaling phenotypes. % Gli-luciferase signal remaining after siRNA treatment in S12 cells with (black) or without Hh (gray) normalized to 100% for siNTC + Hh. Dotted and dashed lines indicate the siIft88 luciferase levels – and + Hh, respectively. The means and SDs of three independent experiments are plotted. *p ≤ 0.05; **p ≤ 0.01 vs. siNTC (+Hh data only). (E) Quantitation of mRNA knockdown. The % mRNA remaining relative to siNTC (means and SDs of one triplicate experiment) after siRNA treatment in 3T3 (gold) and S12 (light yellow) cells, with remaining Ift88 mRNA levels marked with dotted and dashed lines, respectively. Crosses indicate genes with low to undetectable levels of mRNA as measured by qRT-PCR TaqMan analysis (Ct > 34.5). Genes listed in red were chosen for further validation; blue are controls.

