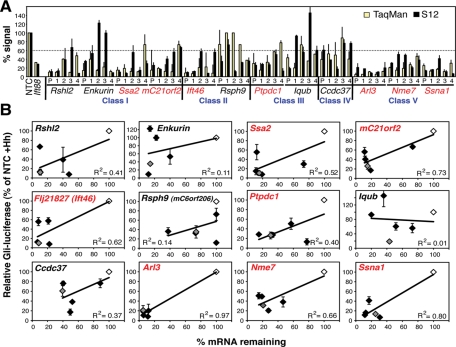
FIGURE 3:
Correlation of S12 phenotype with mRNA knockdown of 12 selected genes. (A) Comparison of mRNA and S12 Hh signaling levels. siRNA knockdown was performed in Hh-treated S12 cells with pooled siRNAs (P) and their four component individual siRNAs (1–4) to the indicated genes. The percentage of mRNA remaining after siRNA knockdown (normalized to NTC as 100%) was measured by TaqMan RT-PCR (yellow), and cilia function was measured using the S12 Gli-luciferase assay + Hh (black). The means and standard deviations (SDs) of three experiments are shown. The dotted line indicates the cutoff value used (60%) for selecting top quality hits in (B). (B) Correlation of cilia function (Hh signaling) and gene knockdown. Same data as in (A) plotted with Gli-luciferase levels (as % siNTC + Hh) on the y-axes and remaining mRNA levels (as % siNTC) on the x-axes. Gray diamonds are pooled siRNAs, black are the four individual siRNAs, and white are the siNTCs. The means and SDs of three independent S12 experiments are shown. R2 is the Spearman’s rho coefficient of correlation. The seven genes in red were considered the top hits due to good correlation.

