FIGURE 6:
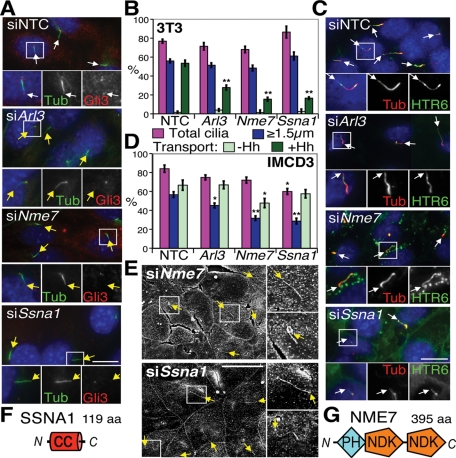
Effects of Class V gene knockdowns (cilia transport defects). (A) Representative images of NTC, Arl3-, Nme7-, and Ssna1-depleted 3T3 cells stained as in Figure 1B. White and yellow arrows indicate Gli3+ and Gli3− cilia tips, respectively. Scale bar is 10 μm; insets show 2× magnification of the boxed regions with individual and merged channels. (B) 3T3 cilia quantitations following Class V gene depletion. **p ≤ 0.01 vs. NTC. (C) Representative images of Class V–depleted IMCD3 HTR6-GFP cells, with white arrows indicating cilia tips. (D) IMCD3 cilia quantitations. *p ≤ 0.05, **p ≤ 0.01 vs. NTC. (E) SEM of Nme7- and Ssna1-depleted IMCD3 cells. Upper insets on the right of each panel show 2× magnified cilia typical of the majority, whereas lower insets show examples of the few abnormally bent or kinked cilia. Yellow arrows point to cilia tips. Scale bar is 10 μm. Schematics of SSNA1 (F) and NME7 (G) protein domains, drawn approximately to scale. CC, coiled-coil.

