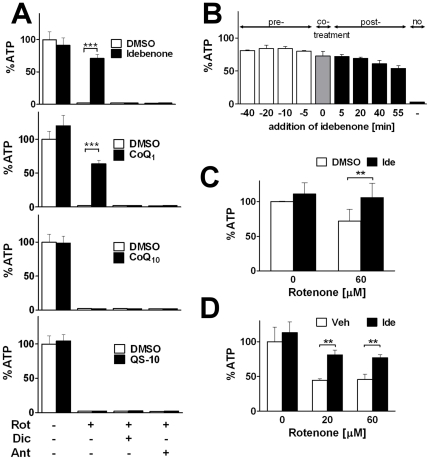
Figure 3. Idebenone and CoQ1 rescue ATP levels in complex I-repressed hepatocytes.
(A) HepG2 cells were incubated with rotenone (Rot; 60 µM), dicoumarol (Dic; 20 µM) or antimycin A (Ant, 6 µM) in absence (empty bars) or presence (filled bars) of different quinones (5 µM idebenone, CoQ1, CoQ10 or QS-10) for 1 hour. ATP levels were normalized to protein and expressed as percentage of DMSO-treated cells in absence of rotenone. (B) HepG2 cells were incubated with 6 µM rotenone for 60 minutes, while 10 µM idebenone was pre-, co- or post-incubated regarding the time point of rotenone addition. ATP levels are expressed as percentage of untreated cells. Bars represent mean +stdev of triplicates of one typical out of two independent experiments. (C) Rescue of ATP levels of rotenone-treated (60 µM) primary mouse hepatocytes by acute idebenone treatment (5 µM) for 1 hour. Bars represent mean +stdev of six independent experiments. (D) Idebenone (400 mg/kg/day; p.o.) was administered to mice over 4 weeks and protection of ATP levels was maintained in rotenone-treated (20 and 60 µM for 1 hour) primary hepatocytes ex vivo without acute addition of idebenone. Bars represent mean +stdev of duplicates from each one idebenone- and sham-treated mouse. ATP levels were normalized to cell number and expressed as percentage of sham-treated hepatocytes in absence of rotenone. p**<0.01, p***<0.001.

