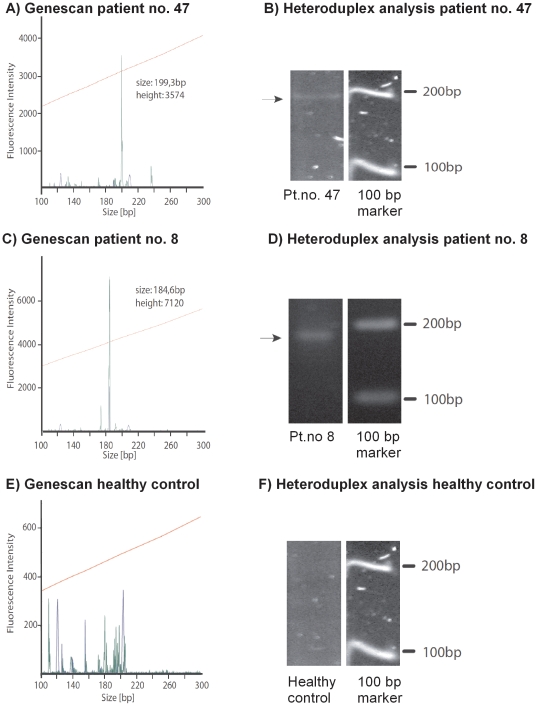
Figure 3. Analysis of TCRD rearrangement and heteroduplex analysis confirms the clonal expansion of γδ-T cells.
For the fragment and heteroduplex analyses two representative examples of three CD patients are shown. A) Genescan analysis of patient number 47 shows a single monoclonal peak at 199 bp with a fluorescence intensity of 3574. B) Heteroduplex analysis of the same sample demonstrates a dominant band of approximately 200 bp. C) Genescan of patient number 8 shows a single monoclonal peak at 184 bp with a fluorescence intensity of 7120. D) Heteroduplex analysis of the same sample shows a very prominent band in the range of 180–190 bp. E) Genescan of a healthy control shows various polyclonal bands with different sizes and generally low fluorescence intensity. F) Heteroduplex analysis of the same sample resulted in a DNA smear with weak fluorescence intensity.

