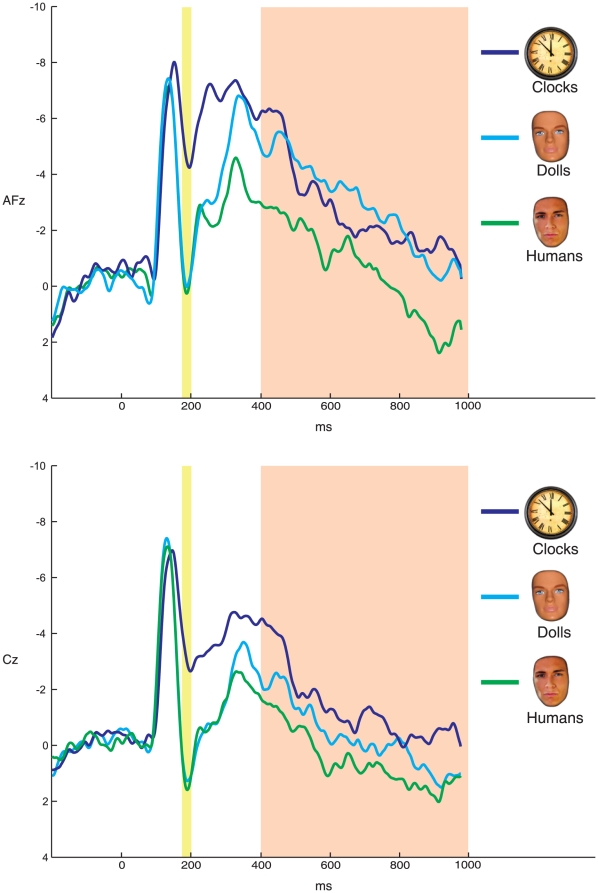
Figure 2. Stimulus-locked ERPs.
ERPs elicited by human faces, doll faces, and clocks at frontal and central recording sites AFz (top) and Cz (bottom), respectively. The vertex positivity is highlighted in the yellow shaded region. The VPP is evident as a positive deflection maximal around 180 ms and is larger (i.e., more positive) for both human and doll faces relative to clocks. This difference is maximal at Cz (bottom graph). However, human faces elicited a larger later positive potential relative to both clocks and doll faces. This difference began following the vertex positivity and continued for the duration of stimulus presentation (highlighted in the orange shaded region). The LPP was maximal at AFz (top).

