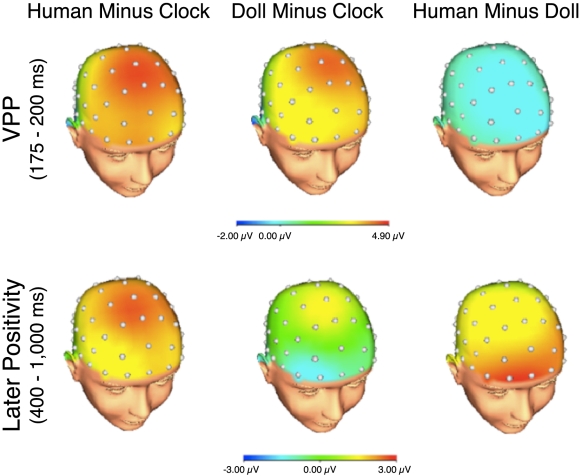
Figure 3. Scalp distributions of ERP differences.
Scalp distributions of the difference between human faces and clocks (left), doll faces and clocks (middle), and human faces and doll faces (right) in the time range of the vertex positivity (i.e., 175–200 ms; top) and later positivity (i.e., 400–1,000 ms; bottom). Relative to clocks, both human and doll faces elicited an increased vertex positivity (top). However, human faces elicited an increased later positivity relative to both clocks and doll faces (bottom).

