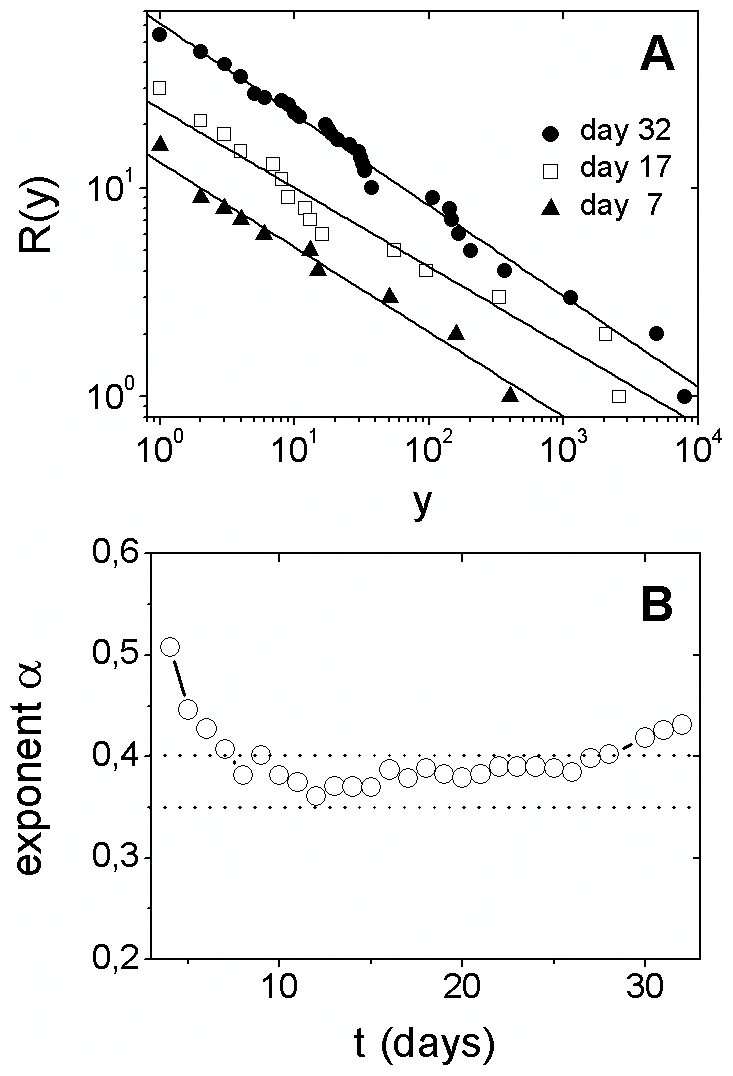
Figure 2. Cumulative distribution of cases among countries: power law behavior.

(A) Empirical cumulative distribution, R(y), of laboratory-confirmed cases y for distinct times (few specific days are displayed for better visualization). The solid lines are power laws, given by Eq. (1), with exponents following Fig. 2B. (B) Temporal evolution of the power law exponent α, obtained by least-square fits to the data. Observe that 0.35<α<0.40 for a period of about 20 days.
