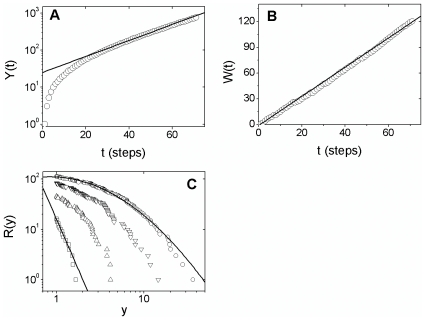
Figure 4. Simulation of the stochastic model.
The model is given by Eq. (3), with  and
p = 0.85. Initial condition: there
are only one country with
y(t = 0)
= 1. (A) Temporal evolution of the total
number of confirmed cases, Y(t), on
mono-log scale, for time steps from 1 to 70. The solid line is given by
 , with
λ = 0.05. (B)
Temporal evolution of the total number of countries with confirmed cases,
W(t), for the same time steps. The
solid line is
  .
(C) Cumulative distribution,
R(y), for
t = 10 steps (squares),
t = 30 (up triangles),
t = 50 (down triangles) and
t = 70 (circles). For comparison,
we show a power law given by Eq. (1), for
t = 10, and a lognormal curve given by
Eq. (2) for t = 10 steps.

